Performance Log
Performance is always a crucial topic for web-based applications. Administrators need to have the possibility to see which activities use which time to execute over time to identify potential increases over time and take proper measures.
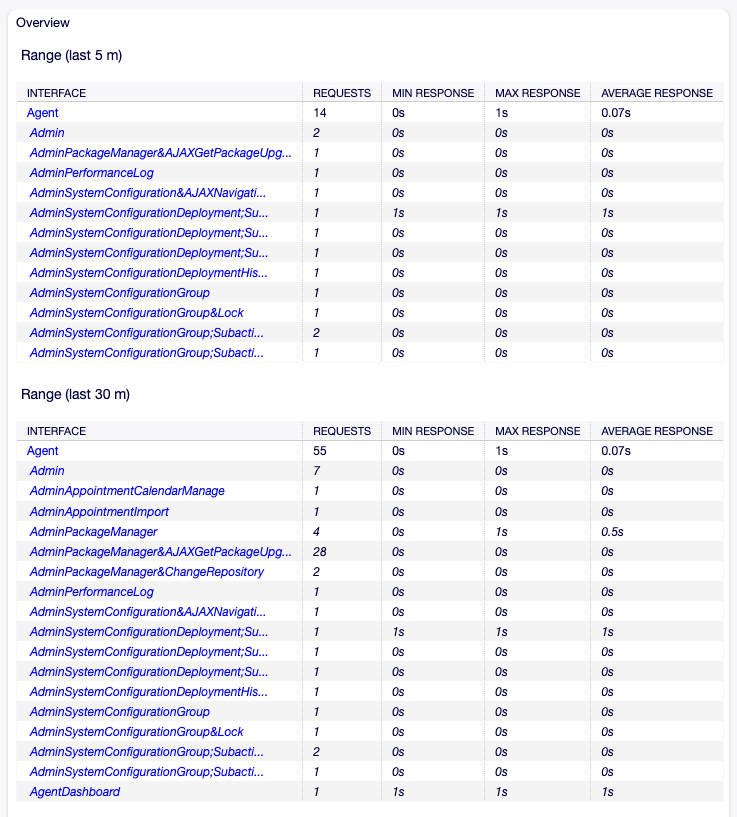
OTOBO supports this requirement with the performance log. The performance log can, when it is activated, log activities and display various activity types and their min/max/average response time and a number of requests for different time frames.
Use this screen to view the performance log of OTOBO. The log overview screen is available in the Performance Log module of the Administration group.
Note
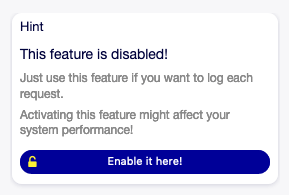
To be able to see performance log in OTOBO, you have to enable its setting first.

Enable Performance Log Support
If the performance log is enabled, OTOBO collects all the information about requests and responses in an overview table.

Performance Log Screen
Clicking on an entry will show the details.

Performance Log Details Screen